Istio on Katacoda
Deploy Istio on Kubernetes
This guide is fully followed from Katacoda.com, where you may have a better experience, importantly without any local env setup. This guide will create an environment locally, and so that we can dive deeper to the configuration behind the CLIs.
Step 1 Docker & Kubernetes + Istio
Download Istio config set
1
2
3
4
> mkdir -p /path/to/istio
> git init
> git pull https://github.com/katacoda-scenarios/istio-katacoda-scenarios.git
> cd /path/to/istio/assets
Health Check
Docker for Mac Edge version, shipping K8s together now. Enable it, this will launch a two-node Kubernetes cluster with one master and one node. You can get the status of the cluster with
1
kubectl cluster-info
Step 2 Deploy Istio
Istio is installed in two parts. The first part involves the CLI tooling that will be used to deploy and manage Istio backed services. The second part configures the Kubernetes cluster to support Istio.
Install CLI tooling
The following command will install the Istio 0.2.7 release. However, I haven’t try from official, which has latest version 0.6.0
1
curl -L http://assets.joinscrapbook.com/istio/getLatestIstio | sh -
After it has successfully run, add the bin folder to your path.
1
export PATH="$PATH:/root/istio-0.2.7/bin"
Or download latest from here - https://github.com/istio/istio/releases/
Configure Istio
The core components of Istio are deployed via istio.yaml.
1
2
3
4
5
6
kubectl apply -f istio.yaml

OR
# https://serverfault.com/questions/791715/using-environment-variables-in-kubernetes-deployment-spec
export HOST_IP=localhost
envsubst < istio.yml | kubectl apply -f -
This will deploy Pilot, Mixer, Ingress-Controller, and Egress-Controller, and the Istio CA (Certificate Authority). These are explained in the next step.
Check Status
All the services are deployed as Pods. Once they’re running, Istio is correctly deployed.
1
kubectl get pods -n istio-system
Step 3 Istio Architecture
The previous step deployed the Istio Pilot, Mixer, Ingress-Controller, and Egress-Controller, and the Istio CA (Certificate Authority).
-
Pilot - Responsible for configuring the Envoy and Mixer at runtime.
-
Envoy - Sidecar proxies per microservice to handle ingress/egress traffic between services in the cluster and from a service to external services. The proxies form a secure microservice mesh providing a rich set of functions like discovery, rich layer-7 routing, circuit breakers, policy enforcement and telemetry recording/reporting functions.
-
Mixer - Create a portability layer on top of infrastructure backends. Enforce policies such as ACLs, rate limits, quotas, authentication, request tracing and telemetry collection at an infrastructure level.
-
Ingress/Egress - Configure path based routing.
-
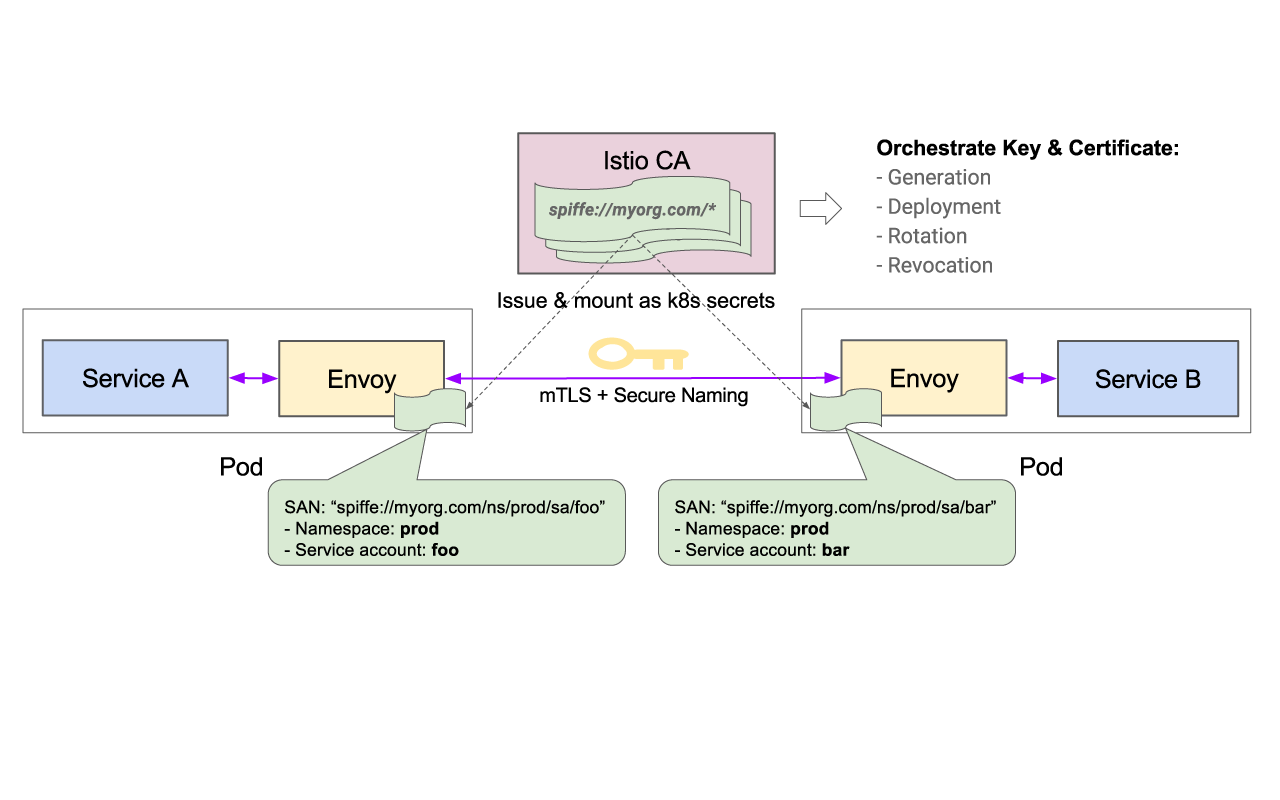
Istio CA - Secures service to service communication over TLS. Providing a key management system to automate key and certificate generation, distribution, rotation, and revocation
The overall architecture is shown below.

Step 4 Deploy Istio Metrics and Tracing
To collect and view metrics provided by Mixer, install Prometheus Grafana and ServiceGraph addons.
Prometheus gathers metrics from the Mixer.
1
kubectl apply -f addons/prometheus.yaml
Grafana produces dashboards based on the data collected by Prometheus.
1
kubectl apply -f addons/grafana.yaml
ServiceGraph delivers the ability to visualise dependencies between services.
1
kubectl apply -f addons/servicegraph.yaml
Zipkin offers distributed tracing.
1
kubectl apply -f addons/zipkin.yaml
Check Status
As with Istio, these addons are deployed via Pods.
1
kubectl get pods -n istio-system
Step 5 Deploy Sample Application
To showcase Istio, a BookInfo web application has been created. This sample deploys a simple application composed of four separate microservices which will be used to demonstrate various features of the Istio service mesh.
When deploying an application that will be extended via Istio, the Kubernetes YAML definitions are extended via kube-inject. This will configure the services proxy sidecar (Envoy), Mixers, Certificates and Init Containers.
1
kubectl apply -f <(istioctl kube-inject -f bookinfo/bookinfo.yaml)
Check Status
1
kubectl get pods
When the Pods are starting, you may see initiation steps happening as the container is created. This is configuring the Envoy sidebar for handling the traffic management and authentication for the application within the Istio service mesh.
Once running the application can be accessed via the path /productpage.
http://localhost/productpage
The ingress routing information can be viewed using
1
kubectl describe ingress
The architecture of the application is described in the next step.
Step 6 Bookinfo Architecture
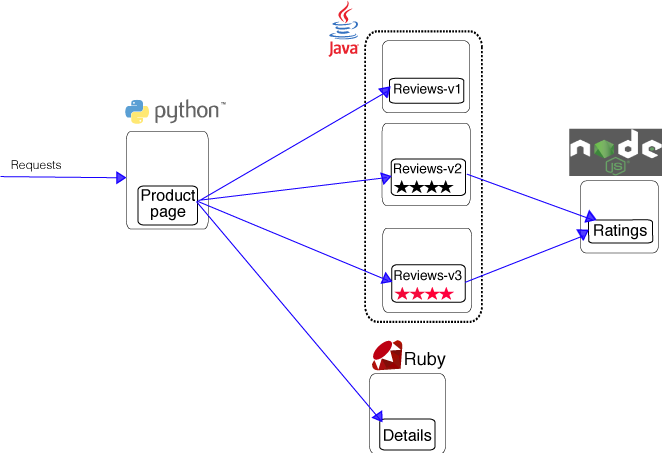
The BookInfo sample application deployed is composed of four microservices:
- The productpage microservice is the homepage, populated using the details and reviews microservices.
- The details microservice contains the book information.
- The reviews microservice contains the book reviews. It uses the ratings microservice for the star rating.
- The ratings microservice contains the book rating for a book review.
The deployment included three versions of the reviews microservice to showcase different behaviour and routing:
- Version v1 doesn’t call the ratings service.
- Version v2 calls the ratings service and displays each rating as 1 to 5 black stars.
- Version v3 calls the ratings service and displays each rating as 1 to 5 red stars.
The services communicate over HTTP using DNS for service discovery. An overview of the architecture is shown below.

The source code for the application is available on Github
Step 7 Control Routing
One of the main features of Istio is its traffic management. As a Microservice architectures scale, there is a requirement for more advanced service-to-service communication control.
User Based Testing
One aspect of traffic management is controlling traffic routing based on the HTTP request, such as user agent strings, IP address or cookies.
The example below will send all traffic for the user “jason” to the reviews:v2, meaning they’ll only see the black stars.
1
cat bookinfo/route-rule-reviews-test-v2.yaml
Similarly to deploying Kubernetes configuration, routing rules can be applied using istioctl.
1
istioctl create -f bookinfo/route-rule-reviews-test-v2.yaml
Visit the product page and signin as a user jason (password jason)
Traffic Shaping for Canary Releases
The ability to split traffic for testing and rolling out changes is important. This allows for A/B variation testing or deploying canary releases.
The rule below ensures that 50% of the traffic goes to reviews:v1 (no stars), or reviews:v3 (red stars).
1
cat bookinfo/route-rule-reviews-50-v3.yaml
Likewise, this is deployed using istioctl.
1
istioctl create -f bookinfo/route-rule-reviews-50-v3.yaml
Note: The weighting is not round robin, multiple requests may go to the same service.
New Releases
Given the above approach, if the canary release were successful then we’d want to move 100% of the traffic to reviews:v3.
1
cat bookinfo/route-rule-reviews-v3.yaml
This can be done by updating the route with new weighting and rules.
1
istioctl replace -f bookinfo/route-rule-reviews-v3.yaml
List All Routes
It’s possible to get a list of all the rules applied using
1
istioctl get routerules
Step 8 Access Metrics
With Istio’s insight into how applications communicate, it can generate profound insights into how applications are working and performance metrics.
Generate Load
Make view the graphs, there first needs to be some traffic. Execute the command below to send requests to the application.
1
2
3
4
5
while true; do
  curl -s http://localhost/productpage > /dev/null
  echo -n .;
  sleep 0.2
done
Access Dashboards
With the application responding to traffic the graphs will start highlighting what’s happening under the covers.
Grafana
The first is the Istio Grafana Dashboard. The dashboard returns the total number of requests currently being processed, along with the number of errors and the response time of each call.
http://localhost:3000/dashboard/db/istio-dashboard
As Istio is managing the entire service-to-service communicate, the dashboard will highlight the aggregated totals and the breakdown on an individual service level.
Zipkin
Zipkin provides tracing information for each HTTP request. It shows which calls are made and where the time was spent within each request.
http://localhost:9411/zipkin/?serviceName=productpage
Click on a span to view the details on an individual request and the HTTP calls made. This is an excellent way to identify issues and potential performance bottlenecks.
Service Graph
As a system grows, it can be hard to visualise the dependencies between services. The Service Graph will draw a dependency tree of how the system connects.
http://localhost:8088/dotviz
Before continuing, stop the traffic process with Ctrl+C
Step 9 Visualise Cluster using Weave Scope
While Service Graph displays a high-level overview of how systems are connected, a tool called Weave Scope provides a powerful visualisation and debugging tool for the entire cluster.
Using Scope it’s possible to see what processes are running within each pod and which pods are communicating with each other. This allows users to understand how Istio and their application is behaving.
Deploy Scope
Scope is deployed onto a Kubernetes cluster with the command, kubectl create v.s apply
1
2
3
kubectl create -f "https://cloud.weave.works/k8s/scope.yaml?k8s-version=$(kubectl version | base64 | tr -d '\n')"
OR
kubectl apply -f addons/weavescope.yaml
Wait for it to be deployed by checking the status of the pods using
1
kubectl get pods -n weave
Make Scope Accessible
Once deployed, expose the service to the public.
1
2
3
4
5
6
7
deploy=$(kubectl get deploy -n weave --selector=name=weave-scope-app -o jsonpath={.items..metadata.name})
kubectl expose deploy/$deploy -n weave --type=LoadBalancer --name=my-$deploy

OR

pod=$(kubectl get pods -n weave --selector=name=weave-scope-app -o jsonpath={.items..metadata.name})
kubectl port-forward $pod 4040:4040 -n weave
Important: Scope is a powerful tool and should only be exposed to trusted individuals and not the outside public. Ensure correct firewalls and VPNs are configured.
View Scope on port 4040 at http://localhost:4040/
Generate Load
Scope works by mapping active system calls to different parts of the application and the underlying infrastructure. Create load to see how various parts of the system now communicate.
1
2
3
4
5
while true; do
  curl -s http://localhost/productpage > /dev/null
  echo -n .;
  sleep 0.2
done
More to learn
